Distinguishing between Thymic Epithelial Tumors and Benign Cysts via Computed Tomography
Abstract
OBJECTIVE:
To investigate whether computed tomography (CT) and fluorine-18-labeled fluoro-2-deoxy-D-glucose (FDG) positron emission tomography (PET) may be applied to distinguish thymic epithelial tumors (TETs) from benign cysts in the anterior mediastinum.
MATERIALS AND METHODS:
We included 262 consecutive patients with pathologically proven TETs and benign cysts 5 cm or smaller who underwent preoperative CT scans. In addition to conventional morphological and ancillary CT findings, the relationship between the lesion and the adjacent mediastinal pleura was evaluated qualitatively and quantitatively. Mean lesion attenuation was measured on CT images. The maximum standardized uptake value (SUVmax) was obtained with FDG-PET scans in 40 patients. CT predictors for TETs were identified with multivariate logistic regression analysis. For validation, we assessed the diagnostic accuracy and inter-observer agreement between four radiologists in a size-matched set of 24 cysts and 24 TETs using a receiver operating characteristic curve before and after being informed of the study findings.
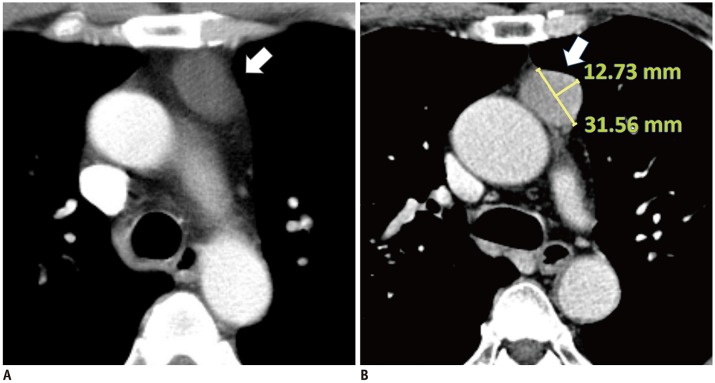
Protrusion length and protrusion ratio on axial CT image.
A. 58-year-old female with 3.5-cm thymic cyst (arrow). Lesion abuts to adjacent mediastinal pleura but does not protrude: both protrusion length and protrusion ratio are 0. B. 64-year-old male with 3.4-cm thymic carcinoma (arrow), showing protrusion to mediastinal pleura. Protrusion length = 12.7 mm, protrusion ratio = (12.7 / 31.6) × 100 = 40.2%.
RESULTS:
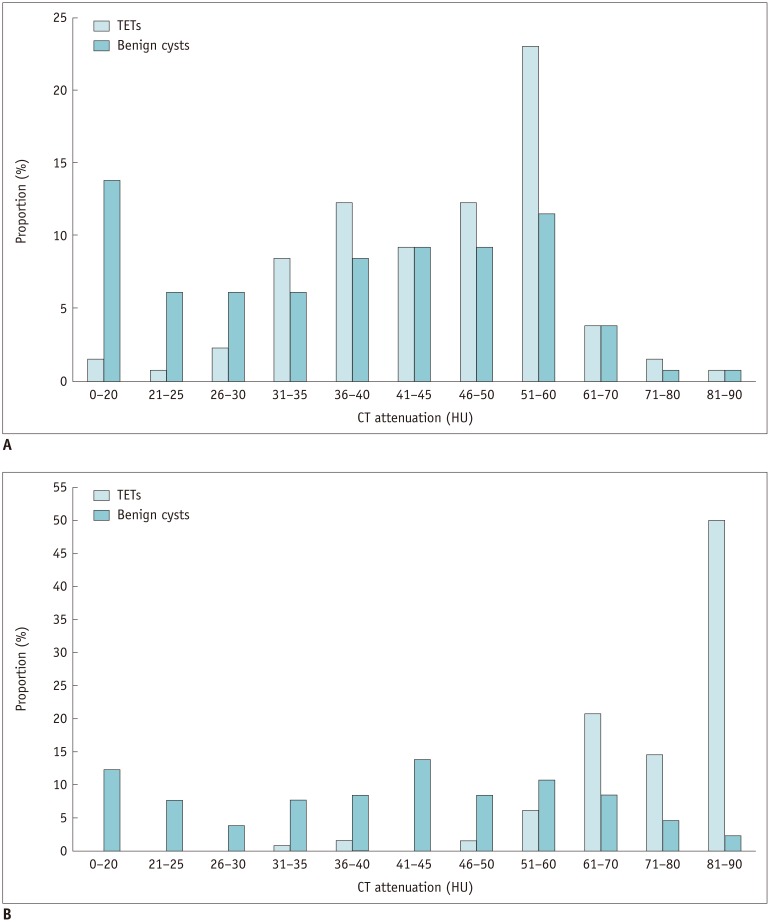
The multivariate analysis showed that post-contrast attenuation of 60 Hounsfield unit or higher (odds ratio [OR], 12.734; 95% confidence interval [CI], 2.506-64.705; p = 0.002) and the presence of protrusion from the mediastinal pleura (OR, 9.855; 95% CI, 1.749-55.535; p = 0.009) were the strongest CT predictors for TETs. SUVmax was significantly higher in TETs than in cysts (5.3 ± 2.4 vs. 1.1 ± 0.3; p < 0.001). After being informed of the study findings, the readers' area under the curve improved from 0.872-0.955 to 0.949-0.999 (p = 0.066-0.149). Inter-observer kappa values for protrusion were 0.630-0.941.
Distribution of (A) pre- and (B) post-contrast CT attenuation of TETs and benign cysts.
CONCLUSION:
Post-contrast CT attenuation, protrusion from the mediastinal pleura, and SUVmax were useful imaging features for distinguishing TETs from cysts in the anterior mediastinum.
Statistical Analysis
Categorical variables were compared using the chi-square or Fisher exact test, and the independent t test was performed for continuous variables. Fisher's exact test was performed to identify any anatomical factors related to pseudoenhancement of benign cysts. To determine the optimal cut-off for continuous variables, we used receiver operating characteristic (ROC) curve analysis for the following parameters: protrusion length, protrusion ratio, mean attenuation value in pre- and post-contrast images, degree of absolute enhancement, and SUVmax. The diagnostic capacity of SUVmax was compared with that of protrusion length and protrusion ratio, respectively, using the DeLong test. CT attenuation variables were not included in the DeLong test due to the small number of patients who underwent both PET/CT and contrast enhanced CT scan (n = 7).
Univariate and multivariate logistic regression analyses were performed to identify significant CT predictors for TETs (13), and additional multivariate logistic regression analysis was performed between the low risk group (WHO types A, AB, and B1) and cysts.
In the validation dataset, the areas under the ROC curves (AUC) of the two interpretation sessions for each reader were compared using the DeLong test to check whether awareness of the results of the training dataset improved readers' diagnostic performance. Kappa statistics and intraclass correlation coefficients (ICCs) were used to measure inter-observer agreement between radiologists in the validation dataset, with values of 0.00–0.20, 0.21–0.40, 0.41–0.60, 0.61–0.80, and 0.81–1.00 considered as poor, fair, moderate, good, and excellent, respectively. The 95% limits of agreement between paired readers were obtained using Bland-Altman analysis.
All statistical analyses were performed using MedCalc for Windows, version 15.0 (MedCalc Software, Ostend, Belgium). P values < 0.05 were considered to indicate a statistically significant difference.
KEYWORDS:
Computed tomography; Cystic mass; FDG-PET/CT; Mediastinum; Thymic tumor
Lee SH, Yoon SH, Nam JG, et al. Distinguishing between Thymic Epithelial Tumors and Benign Cysts via Computed Tomography.Korean J Radiol. 2019 Apr;20(4):671-682. doi: 10.3348/kjr.2018.0400.
PMID: 30887749


 |手机版|小黑屋|爱科学
( 粤ICP备19015697号 )
|手机版|小黑屋|爱科学
( 粤ICP备19015697号 )


