全肿瘤表观扩散系数(ADC)直方图分析鉴别胸腺癌和胸腺淋巴瘤
A Whole-Tumor Histogram Analysis of Apparent Diffusion Coefficient Maps for Differentiating Thymic Carcinoma from Lymphoma.
本研究证实利用ADC值可用于鉴别胸腺癌和胸腺淋巴瘤
Abstract
OBJECTIVE:
To assess the performance of a whole-tumor histogram analysis of apparent diffusion coefficient (ADC) maps in differentiating thymic carcinoma from lymphoma, and compare it with that of a commonly used hot-spot region-of-interest (ROI)-based ADC measurement.
MATERIALS AND METHODS:
Diffusion weighted imaging data of 15 patients with thymic carcinoma and 13 patients with lymphoma were retrospectively collected and processed with a mono-exponential model. ADC measurements were performed by using a histogram-based and hot-spot-ROI-based approach. In the histogram-based approach, the following parameters were generated: mean ADC (ADCmean), median ADC (ADCmedian), 10th and 90th percentile of ADC (ADC10 and ADC90), kurtosis, and skewness. The difference in ADCs between thymic carcinoma and lymphoma was compared using a t test. Receiver operating characteristic analyses were conducted to determine and compare the differentiating performance of ADCs.
RESULTS:
Lymphoma demonstrated significantly lower ADCmean, ADCmedian, ADC10, ADC90, and hot-spot-ROI-based mean ADC than those found in thymic carcinoma (all p values < 0.05). There were no differences found in the kurtosis (p = 0.412) and skewness (p = 0.273). The ADC10 demonstrated optimal differentiating performance (cut-off value, 0.403 × 10⁻³ mm2/s; area under the receiver operating characteristic curve [AUC], 0.977; sensitivity, 92.3%; specificity, 93.3%), followed by the ADCmean, ADCmedian, ADC90, and hot-spot-ROI-based mean ADC. The AUC of ADC10 was significantly higher than that of the hot spot ROI based ADC (0.977 vs. 0.797, p = 0.036).
CONCLUSION:
Compared with the commonly used hot spot ROI based ADC measurement, a histogram analysis of ADC maps can improve the differentiating performance between thymic carcinoma and lymphoma.
KEYWORDS:
Apparent diffusion coefficient; Diffusion weighted imaging; Histogram analysis; Lymphoma; Mediastinal mass; Thymic carcinoma
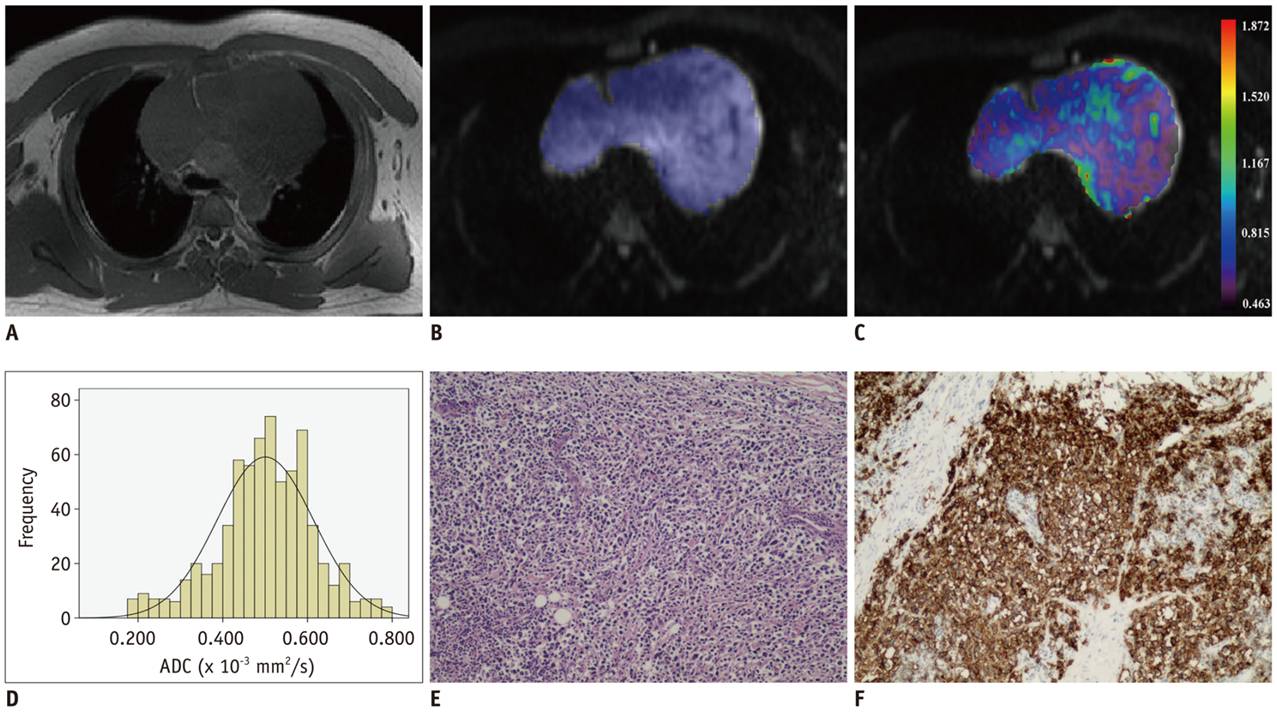
Fig. 1
Images of 39-year-old man with diffuse large B cell lymphoma.
Axial T1-weighted image (A) shows mass in anterior mediastinal region. After ROI was placed (B), pixel-by-pixel colored ADC map (C) was generated and embedded in axial diffusion-weighted imaging. Histogram analysis of whole lesion shows lower cumulative ADC value but higher relative frequency (D). ADCmedian and ADC10 were 0.502 and 0.146 × 10⁻³ mm2/s, respectively. Typical histopathologic appearance on hematoxylin-eosin stain (E, × 10) and CD20 positive on immunohistochemistry (F, × 10) confirmed diagnosis of lymphoma.
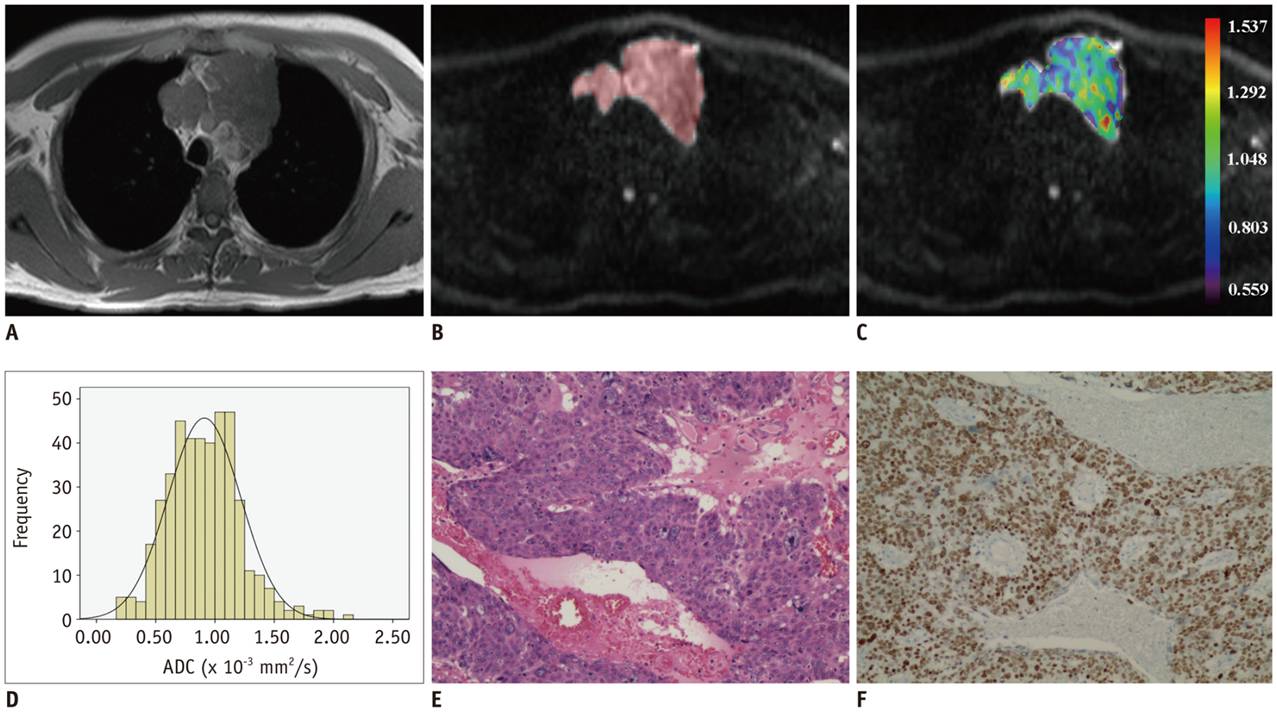
Fig. 2
Images of 42-year-old man with thymic squamous cell carcinoma.
Axial T1-weighted image shows mass in anterior mediastinal region (A). After ROI was placed (B), pixel-by-pixel colored ADC map (C) was generated and embedded in axial diffusion-weighted imaging. Compared with lymphoma, histogram analysis of whole lesion showed higher cumulative ADC value but lower relative frequency (D). ADCmedian and ADC10 were 0.895 and 0.395 × 10⁻³ mm2/s, respectively. Typical histopathologic appearance on hematoxylin-eosin stain (E, × 10) and P63 positive on immunohistochemistry (F, × 10) confirmed diagnosis of squamous cell carcinoma.
Statistical Analysis
Statistical analyses were performed using a software package (SPSS 19.0, IBM Corp., Armonk, NY, USA). Numeric data was averaged over all patients and reported as mean ± standard deviation, and Kolmogorov-Smirnov's test was used to test normality. The between-group comparisons of age and histogram parameters were compared using independent sample t tests. Comparisons of patient sex were compared using the Fisher exact test. Receiver operating characteristic (ROC) curves were drawn to determine the diagnostic value of the histogram parameters for differentiating two kinds of tumors, with a calculation of the cut-off value, sensitivity, specificity, and area under the ROC curve (AUC). The AUCs were compared using the method developed by Delong et al. (5). The intra-class correlation coefficient (ICC) was used to estimate the inter- and intra-reader agreement of the histogram parameters. ICCs were interpreted as follows: 0.00–0.40 was poor; 0.41–0.60 was moderate; 0.61–0.80 was good; and 0.81–1.00 was excellent. A p value of less than 0.05 indicated statistical significance.
PMID: 29520195 PMCID: PMC5840066 DOI: 10.3348/kjr.2018.19.2.358
Zhang W, Zhou Y, Xu XQ, Kong LY, Xu H, Yu TF, et al. A whole-tumor histogram analysis of apparent diffusion coefficient maps for differentiating thymic carcinoma from lymphoma. Korean J Radiol. 2018;19:358–365.
Tateishi U, Muller NL, Johkoh T, Onishi Y, Arai Y, Satake M, et al. Primary mediastinal lymphoma: characteristic features of the various histological subtypes on CT. J Comput Assist Tomogr. 2004;28:782–789.
Levitt RG, Husband JE, Glazer HS. CT of primary germ-cell tumors of the mediastinum. AJR Am J Roentgenol. 1984;142:73–78.


 |手机版|小黑屋|爱科学
( 粤ICP备19015697号 )
|手机版|小黑屋|爱科学
( 粤ICP备19015697号 )


