|||
Methods:We observed five large-scale tumor-associated collagen signatures (TACS4-8) obtained by multiphoton microscopy at the invasion front of the breast primary tumor, which contrasted with the three tumor-associated collagen signatures (TACS1-3) discovered by Keely and coworkers at a smaller scale. Highly concordant TACS1-8 classifications were obtained by three independent observers. Using the ridge regression analysis, we obtained a TACS-score for each patient based on the combined TACS1-8 and established a risk prediction model based on the TACS-score. In a blind fashion, consistent retrospective prognosis was obtained from 995 breast cancer patients in both a training cohort (n= 431) and an internal validation cohort (n= 300) collected from one clinical center, and in an external validation cohort (n= 264) collected from a different clinical center.
Results: TACS1-8 model alone competed favorably with all reported models in predicting disease-free survival (AUC: 0.838, [0.800-0.872]; 0.827, [0.779-0.868]; 0.807, [0.754-0.853] in the three cohorts) and stratifying low- and high-risk patients (HR 7.032, [4.869-10.158]; 6.846, [4.370-10.726], 4.423, [2.917-6.708]). The combination of these factors with the TACS-score into a nomogram model further improved the prognosis (AUC: 0.865, [0.829-0.896]; 0.861, [0.816-0.898]; 0.854, [0.805-0.894]; HR 7.882, [5.487-11.323]; 9.176, [5.683-14.816], and 5.548, [3.705-8.307]). The nomogram identified 72 of 357 (~20%) patients with unsuccessful 5-year disease-free survival that might have been undertreated postoperatively.
Conclusions: The risk prediction model based on TACS1-8 considerably outperforms the contextual clinical model and may thus convince pathologists to pursue a TACS-based breast cancer prognosis. Our methodology identifies a significant portion of patients susceptible to undertreatment (high-risk patients), in contrast to the multigene assays that often strive to mitigate overtreatment. The compatibility of our methodology with standard histology using traditional (non-tissue-microarray) formalin-fixed paraffin-embedded (FFPE) tissue sections could simplify subsequent clinical translation.
Keywords:Breast cancer; disease-free survival; multiphoton imaging; tumor-associated collagen signatures.
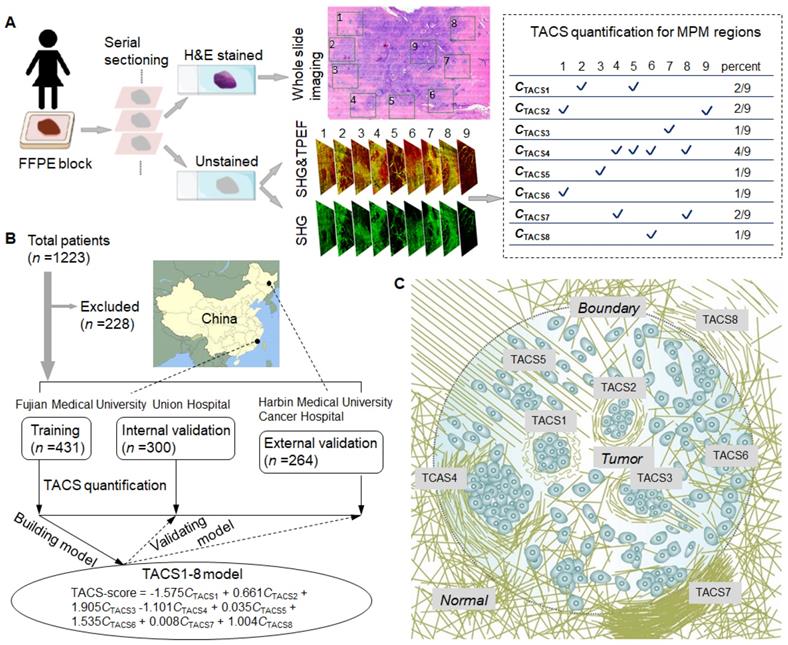
Figure 1 :(A) Extraction and quantification of TACSs for one exemplary patient among the training, internal validation, and external validation cohorts. For one H&E section of a patient, a total of 9 regions of interest (ROIs) are located either at the invasive front (1-8) or inside the tumor (9). (B) Study flowchart to exclude patients with neoadjuvant chemotherapy or radiotherapy, unknown pathological characteristics and follow-up, or damaged and tumor-free sections. The TACS-score is calculated for each patient using the linear combination of TACS percentages weighted by their regression coefficients. (C) Illustration of the structural and organizational features of collagen in the TACSs. TACS1-3 are plotted in the tumor center for simplicity but may be present in the invasion front like TACS4-8.
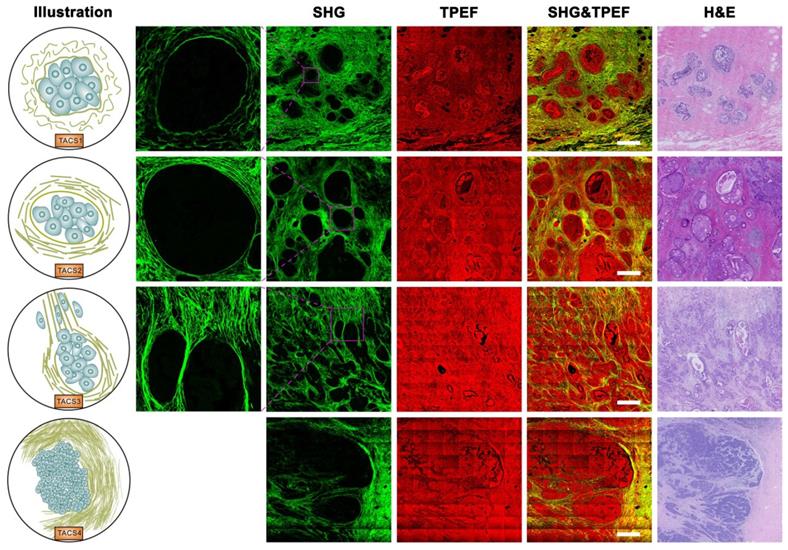
Figure 2 .Images of TACS1-3 (or TACS4) at the initiation (or expansion) stage of tumor development. TACS1: curved collagen fibers wrapped around emergent tumor foci; TACS2: collagen fibers stretched due to tumor growth and aligned more parallel to tumor boundary; TACS3: collagen fibers aligned perpendicular to the tumor boundary in a radiation pattern to facilitate tumor cell migration; TACS4: reticular distribution of collagen fibers adjacent to expanding tumor that leads to a clear tumor boundary. Scale bar: 500 μm.
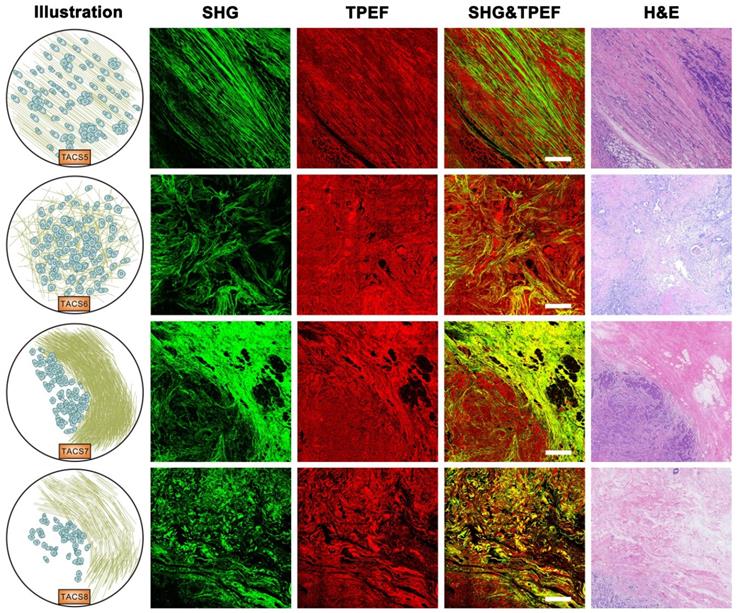
Figure 3:Images of TACS5-8 at the invasion stage of tumor development. TACS5: directionally distributed collagen fibers that enables unidirectional tumor cell migration without a clear tumor boundary; TACS6: chaotically aligned collagen fibers that enables multidirectional tumor cell migration without a clear tumor boundary; TACS7: densely-distributed collagen fibers at the tumor invasion front largely free of tumors cells; TACS8: sparsely-distributed collagen fibers at the tumor invasion front largely free of tumors cells. Scale bar: 500 μm.
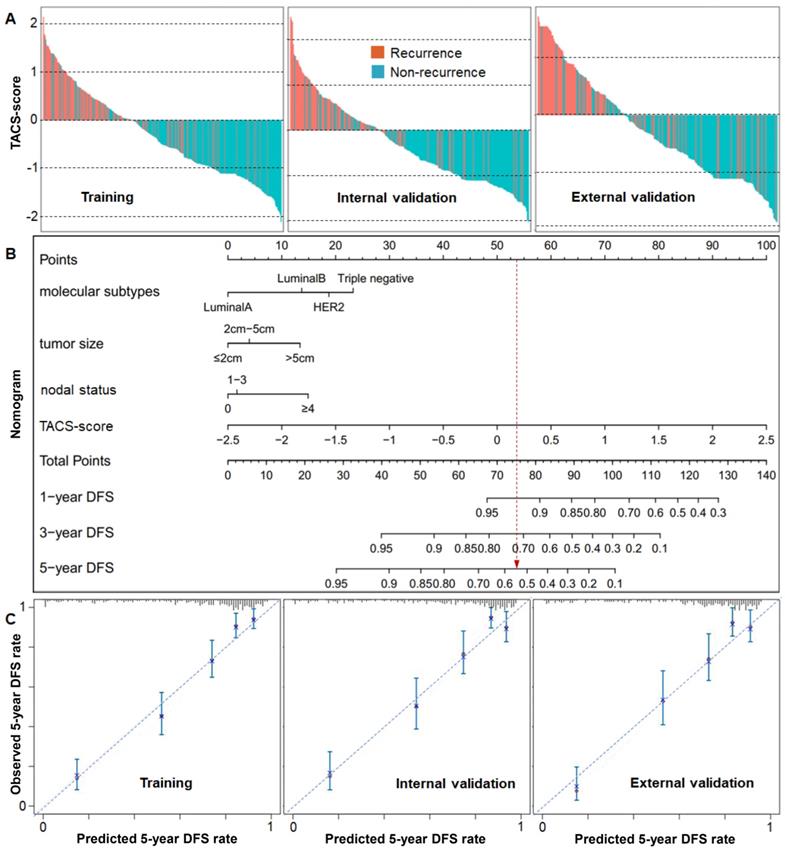
Figure 4 :(A) Recurrence histograms of TACS-score for three cohorts. (B) Nomogram of TACS-score, molecular subtype, tumor size and nodal status derived from the training cohort. (C) Calibration curves of the nomogram to predict 5-year DFS rate for three cohorts.


 |手机版|小黑屋|爱科学
( 粤ICP备19015697号 )
|手机版|小黑屋|爱科学
( 粤ICP备19015697号 )
GMT+8, 2025-7-4 01:47 , Processed in 0.133422 second(s), 27 queries .
Powered by Discuz! X3.5
© 2001-2013 Comsenz Inc.


