胸腺的CT评估:肥胖会影响健康年轻成年人群的胸腺脂肪退化吗?Br J Radiol. 2018
Computed tomographic evaluation of the thymus—does obesity affect thymic fatty involution in a healthy young adult population?
目的:探讨年龄在20至30岁之间的人的体重指数(BMI)升高与胸腺脂肪退化之间的关系。
方法:回顾了94例年龄在20至30岁之间的患者的CT图像。记录定量胸腺平均CT值,并将定性胸腺密度分配给4个可能等级中的1个。记录了BMI和皮下脂肪厚度。使用线性回归模型评估胸腺密度与BMI和皮下脂肪厚度之间的相关性。使用t检验和Pearson X2分析评估了超重与正常体重患者的胸腺CT值差异。
结果:较低的胸腺平均CT值与较高的患者BMI有关(p = 0.024)。体重正常的患者胸腺的平均定量胸腺CT值为15.5 HU,超重患者的胸腺平均定量CT值为-16.4 HU(p = 0.0218)。皮下脂肪厚度增加与平均胸腺定量CT值降低之间存在显著相关性(p <0.0001)。当将定性评估的胸腺0级与2级和3级胸腺进行比较时,皮下脂肪厚度也存在显著差异(分别为p = 0.027和0.001);以及1级和3级(p = 0.001)。
结论:在20至30岁的患者中,胸腺脂肪浸润程度与BMI有关。
知识进展:多层 CT可以评估胸腺的脂肪退化。这项回顾性研究证明了BMI与胸腺脂肪退化有关。皮下脂肪增加的受试者的平均胸腺密度减低。
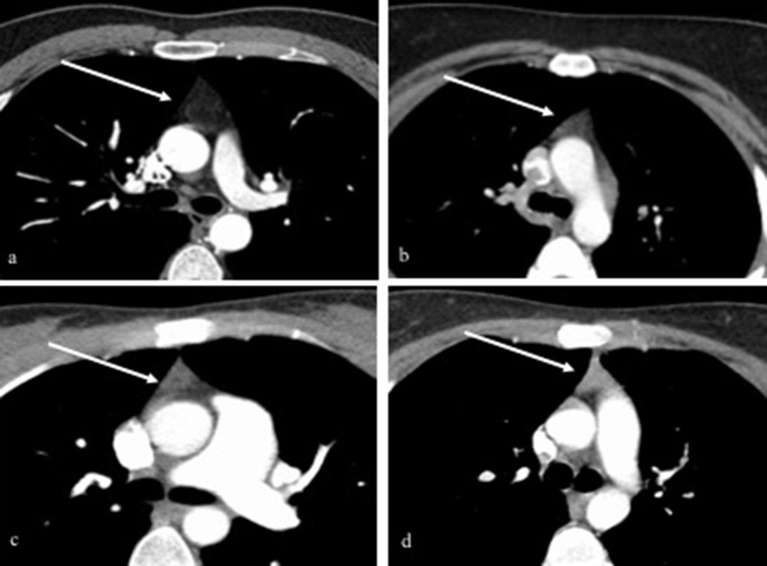
图2. CT胸部胸腺密度不同等级的示例(箭头)。 (a)0级的例子,胸腺难以与背景脂肪区分。 (b)是1级(胸腺主要是脂肪成分)的一个例子。 (c)是2级的一个例子。胸腺的一半脂肪,一半软组织密度。 (d)是3级的一个例子,它显示的胸腺的密度值接近肌肉密度。
Figure 2. Examples of the different grades of thymic density on CT chests (arrows). (a) An example of Grade 0, where the thymus is no longer distinguishable from background fat. (b) Is an example of Grade 1, a predominately fatty thymus. (c) Is an example of Grade 2. The thymus is half fatty, half soft-tissue in attenuation. (d) is an example of Grade 3, demonstrating a thymus with attenuation values approaching that of muscle.
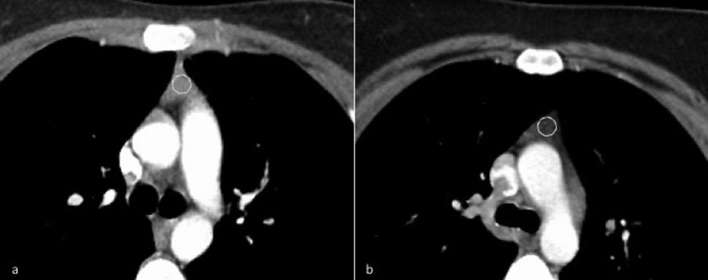
图3.如何将ROI放置在胸腺上(虚线圆圈)的示例。 将ROI放置为包围胸腺的宽度,但要注意不要包括相邻的非胸腺结构。 (b)1级的例子,主要是脂肪性胸腺,在ROI中包含了在胸腺内的交叉分布的脂肪。ROI,感兴趣区。
Figure 3. Example of how a ROI circle was placed on the thymus (dashed circle). The ROI was placed to encompass the width of the thymus gland with care taken not to include adjacent non-thymic structures. (b) An example of Grade 1, predominantly fatty thymus, with interdigitating fat within the thymus included in the ROI. ROI, region of interest.
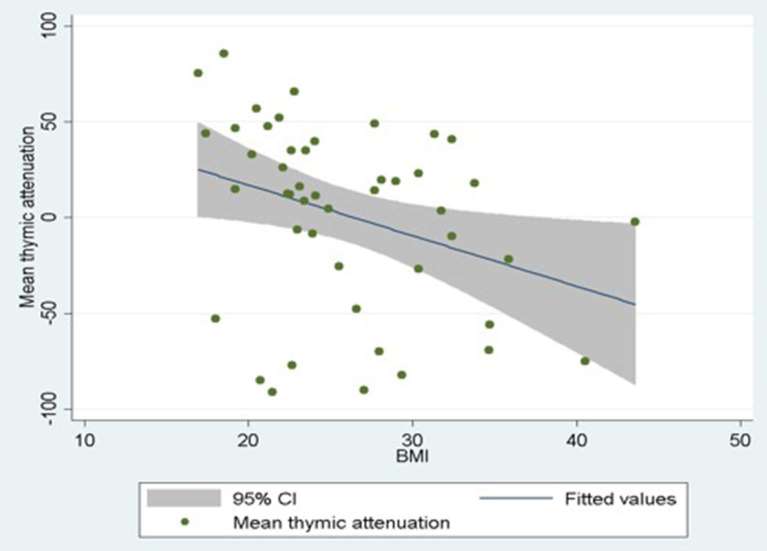
图4.平均胸腺密度作为BMI的函数绘制(p值= 0.024)。
Figure 4. Mean thymic attenuation plotted as a function of BMI (p-value = 0.024).
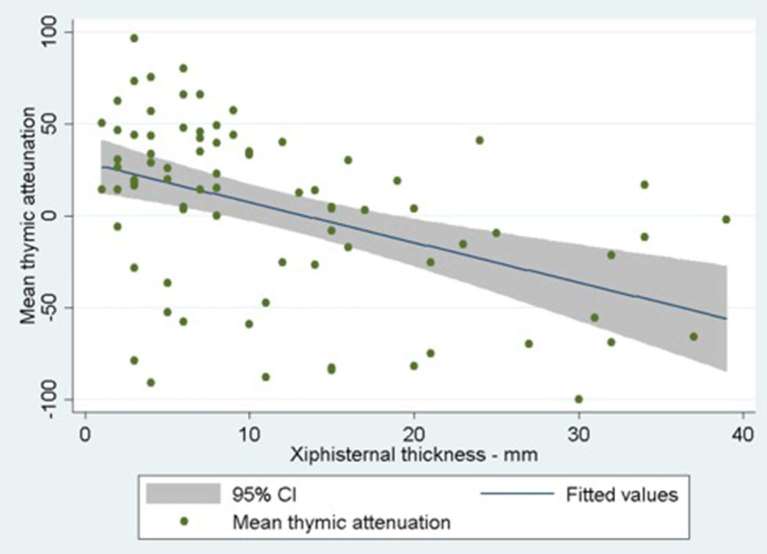
图5.胸腺皮下脂肪的平均胸腺密度与皮下脂肪厚度的关系。 皮下脂肪每增加1 mm,BMI就会增加0.89,p值≤0.001(CI为0.6至1.18)。 BMI,体重指数; CI,置信区间。
Figure 5. Mean thymic attenuation plotted as a function of subcutaneous fat thickness at the xiphisternum. For every 1 mm increase in subcutaneous fat, there was a 0.89 increase in BMI, p-value ≤ 0.001 (CI 0.6 to 1.18). BMI, body mass index; CI, confidence interval.
Objective: To determine a relationship between increased body mass index (BMI) and fatty involution of the thymus in subjects aged between 20 and 30 years.
Methods: CT images of 94 patients aged between 20 and 30 years were reviewed. Quantitative thymic mean attenuation was recorded and qualitative thymic attenuation was assigned to 1 of 4 possible grades. BMI and subcutaneous fat thickness were documented. Correlations between thymic attenuation, and BMI and subcutaneous fat thickness were assessed using linear regression models. Differences in thymic attenuation in overweight vs normal weight patients were assessed using t-test and Pearson Χ2 analysis.
Results: Low mean thymic attenuation values were associated with higher patient BMI (p = 0.024). Normal weight patients had a mean quantitative thymic attenuation of 15.5 Hounsfield unit and overweight patients had a mean quantitative thymic attenuation of -16.4 Hounsfield unit (p = 0.0218). There was a significant association between increasing subcutaneous fat thickness and reduced mean quantitative thymic attenuation (p < 0.0001). There was also a significant difference in subcutaneous fat thickness when comparing qualitatively assessed thymic Grade 0 with grades 2 and 3 (p = 0.027 and 0.001 respectively); and Grade 1 with Grade 3 (p = 0.001).
Conclusion: In patients between 20 and 30 years old, the degree of thymic fatty infiltration is related to BMI.
Advances in knowledge: Multidetector CT can assess fatty involution of the thymus gland. This retrospective study demonstrates a relationship between BMI and thymus gland fatty involution. Subjects with increased subcutaneous fat have decreased mean thymus gland attenuation.
Harrington KA, Kennedy DS, Tang B, Hickie C, Phelan E, Torreggiani W, Halpenny D. Computed tomographic evaluation of the thymus-does obesity affect thymic fatty involution in a healthy young adult population? Br J Radiol. 2018 Sep;91(1089):20170609.


 |手机版|小黑屋|爱科学
( 粤ICP备19015697号 )
|手机版|小黑屋|爱科学
( 粤ICP备19015697号 )


