|
|
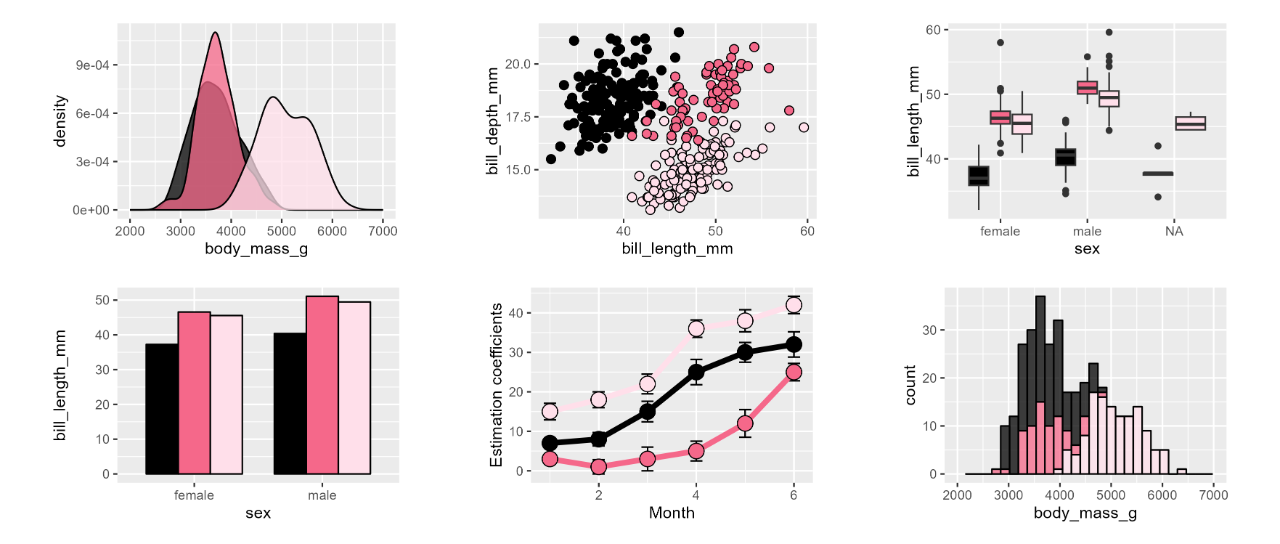
配色方案一


作图数据跟代码:
- library(tidyverse)
- library(palmerpenguins)
- library(patchwork)
- pal = c("#000000", "#f5688a", "#ffdfea")
- ## p1
- penguins %>%
- ggplot() +
- geom_density(aes(x=body_mass_g, fill=species),
- alpha = 0.75) +
- scale_x_continuous(limits = c(2000, 7000)) +
- scale_fill_manual(values=pal, guide="none") +
- theme(plot.margin = margin(10, 30, 10, 30))
- ## p2
- penguins %>%
- ggplot() +
- geom_point(aes(x=bill_length_mm, y=bill_depth_mm, fill=species),
- size=2.5, shape=21, color = "black") +
- scale_fill_manual(values=pal, guide="none") +
- theme(plot.margin = margin(10, 30, 10, 30))
- ##p3
- penguins %>%
- ggplot() +
- geom_boxplot(aes(x=sex, y=bill_length_mm, fill=species)) +
- scale_fill_manual(values=pal, guide="none") +
- theme(plot.margin = margin(10, 30, 10, 30))
- ##p4
- penguins %>%
- filter(!is.na(sex)) %>%
- ggplot(aes(x=sex, y=bill_length_mm)) +
- geom_bar(aes(fill=species),
- stat = "summary", fun="mean",
- color="black", width = 0.75, position = position_dodge()) +
- # geom_jitter(size=2) +
- scale_fill_manual(values=pal, guide="none") +
- theme(plot.margin = margin(10, 30, 10, 30))
- ##p5
- data = read_csv("./data/误差棒图.csv")
- data %>%
- mutate(upper = `Estimation coefficients` + SEM,
- lower = `Estimation coefficients` - SEM) -> df
- ggplot(data = df) +
- geom_errorbar(aes(x=Month, ymin=lower, ymax=upper),
- width = 0.25) +
- geom_line(aes(x=Month, y=`Estimation coefficients`, color=group),
- linewidth=1.75) +
- geom_point(aes(x=Month, y=`Estimation coefficients`, fill=group),
- shape=21, size=4.5) +
- scale_fill_manual(values=pal, guide="none") +
- scale_color_manual(values=pal, guide="none") +
- theme(plot.margin = margin(10, 30, 10, 30))
- ##p6
- penguins %>%
- ggplot() +
- geom_histogram(aes(x=body_mass_g, fill=species),
- alpha = 0.75, color="black") +
- scale_x_continuous(limits = c(2000, 7000)) +
- scale_fill_manual(values=pal, guide="none") +
- theme(plot.margin = margin(10, 30, 10, 30))
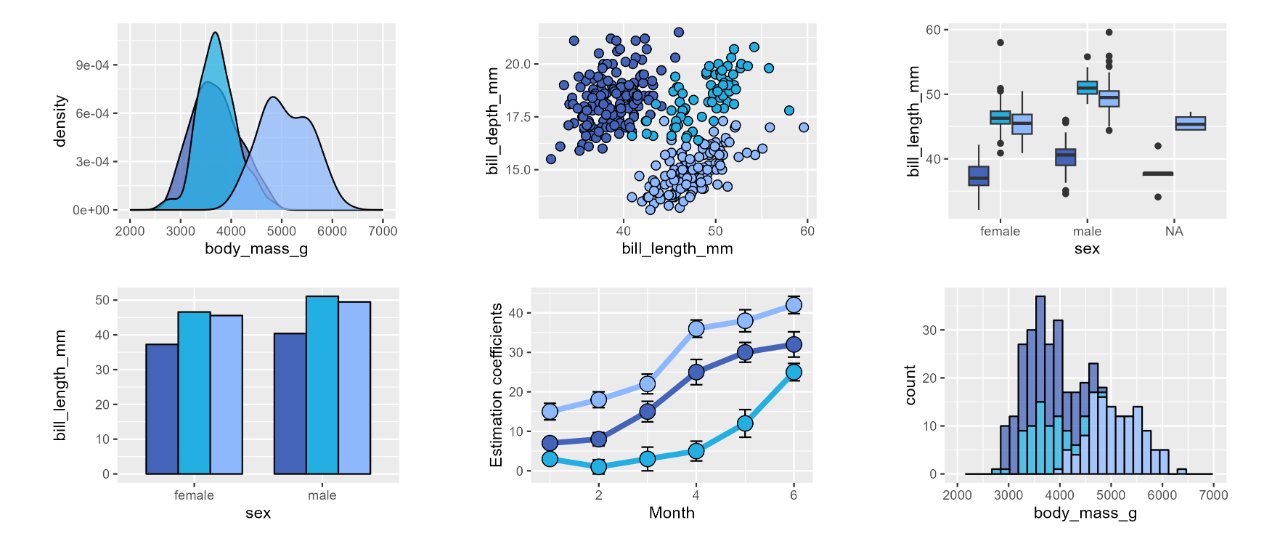
2.配色方案二


作图数据跟代码:
- library(tidyverse)
- library(palmerpenguins)
- library(patchwork)
- pal = c("#4464b9", "#23afe2", "#8db8fd")
- ## p1
- penguins %>%
- ggplot() +
- geom_density(aes(x=body_mass_g, fill=species),
- alpha = 0.75) +
- scale_x_continuous(limits = c(2000, 7000)) +
- scale_fill_manual(values=pal, guide="none") +
- theme(plot.margin = margin(10, 30, 10, 30))
- ## p2
- penguins %>%
- ggplot() +
- geom_point(aes(x=bill_length_mm, y=bill_depth_mm, fill=species),
- size=2.5, shape=21, color = "black") +
- scale_fill_manual(values=pal, guide="none") +
- theme(plot.margin = margin(10, 30, 10, 30))
- ##p3
- penguins %>%
- ggplot() +
- geom_boxplot(aes(x=sex, y=bill_length_mm, fill=species)) +
- scale_fill_manual(values=pal, guide="none") +
- theme(plot.margin = margin(10, 30, 10, 30))
- ##p4
- penguins %>%
- filter(!is.na(sex)) %>%
- ggplot(aes(x=sex, y=bill_length_mm)) +
- geom_bar(aes(fill=species),
- stat = "summary", fun="mean",
- color="black", width = 0.75, position = position_dodge()) +
- # geom_jitter(size=2) +
- scale_fill_manual(values=pal, guide="none") +
- theme(plot.margin = margin(10, 30, 10, 30))
- ##p5
- data = read_csv("./data/误差棒图.csv")
- data %>%
- mutate(upper = `Estimation coefficients` + SEM,
- lower = `Estimation coefficients` - SEM) -> df
- ggplot(data = df) +
- geom_errorbar(aes(x=Month, ymin=lower, ymax=upper),
- width = 0.25) +
- geom_line(aes(x=Month, y=`Estimation coefficients`, color=group),
- linewidth=1.75) +
- geom_point(aes(x=Month, y=`Estimation coefficients`, fill=group),
- shape=21, size=4.5) +
- scale_fill_manual(values=pal, guide="none") +
- scale_color_manual(values=pal, guide="none") +
- theme(plot.margin = margin(10, 30, 10, 30))
- ##p6
- penguins %>%
- ggplot() +
- geom_histogram(aes(x=body_mass_g, fill=species),
- alpha = 0.75, color="black") +
- scale_x_continuous(limits = c(2000, 7000)) +
- scale_fill_manual(values=pal, guide="none") +
- theme(plot.margin = margin(10, 30, 10, 30))
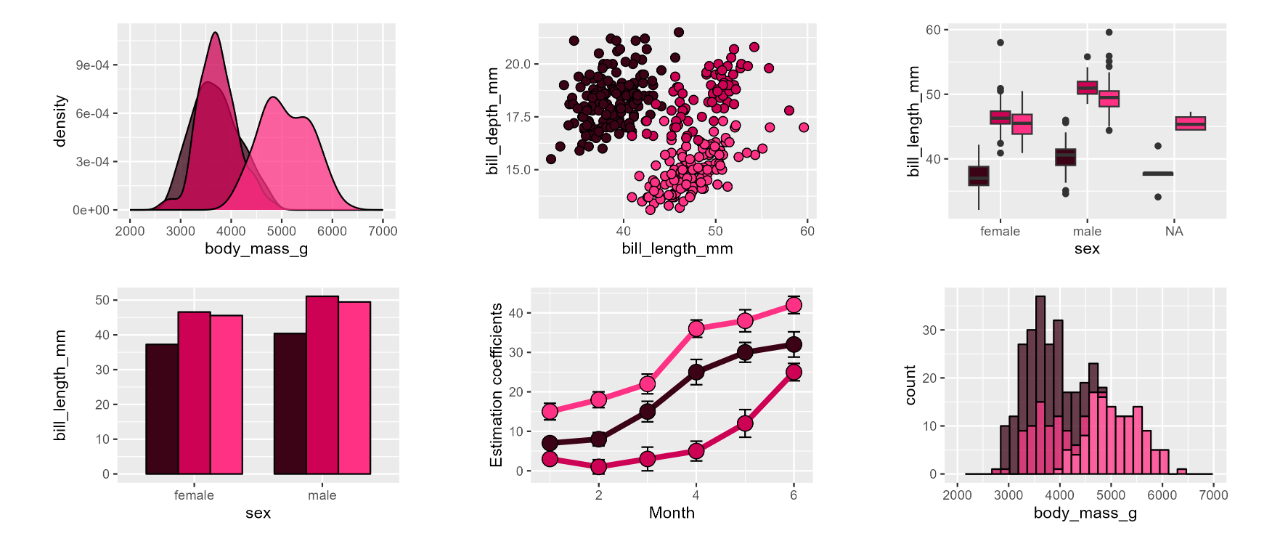
3.配色方案三


作图数据跟代码:
- library(tidyverse)
- library(palmerpenguins)
- library(patchwork)
- pal = c("#3c0316", "#cd0254", "#ff3184")
- ## p1
- penguins %>%
- ggplot() +
- geom_density(aes(x=body_mass_g, fill=species),
- alpha = 0.75) +
- scale_x_continuous(limits = c(2000, 7000)) +
- scale_fill_manual(values=pal, guide="none") +
- theme(plot.margin = margin(10, 30, 10, 30))
- ## p2
- penguins %>%
- ggplot() +
- geom_point(aes(x=bill_length_mm, y=bill_depth_mm, fill=species),
- size=2.5, shape=21, color = "black") +
- scale_fill_manual(values=pal, guide="none") +
- theme(plot.margin = margin(10, 30, 10, 30))
- ##p3
- penguins %>%
- ggplot() +
- geom_boxplot(aes(x=sex, y=bill_length_mm, fill=species)) +
- scale_fill_manual(values=pal, guide="none") +
- theme(plot.margin = margin(10, 30, 10, 30))
- ##p4
- penguins %>%
- filter(!is.na(sex)) %>%
- ggplot(aes(x=sex, y=bill_length_mm)) +
- geom_bar(aes(fill=species),
- stat = "summary", fun="mean",
- color="black", width = 0.75, position = position_dodge()) +
- # geom_jitter(size=2) +
- scale_fill_manual(values=pal, guide="none") +
- theme(plot.margin = margin(10, 30, 10, 30))
- ##p5
- data = read_csv("./data/误差棒图.csv")
- data %>%
- mutate(upper = `Estimation coefficients` + SEM,
- lower = `Estimation coefficients` - SEM) -> df
- ggplot(data = df) +
- geom_errorbar(aes(x=Month, ymin=lower, ymax=upper),
- width = 0.25) +
- geom_line(aes(x=Month, y=`Estimation coefficients`, color=group),
- linewidth=1.75) +
- geom_point(aes(x=Month, y=`Estimation coefficients`, fill=group),
- shape=21, size=4.5) +
- scale_fill_manual(values=pal, guide="none") +
- scale_color_manual(values=pal, guide="none") +
- theme(plot.margin = margin(10, 30, 10, 30))
- ##p6
- penguins %>%
- ggplot() +
- geom_histogram(aes(x=body_mass_g, fill=species),
- alpha = 0.75, color="black") +
- scale_x_continuous(limits = c(2000, 7000)) +
- scale_fill_manual(values=pal, guide="none") +
- theme(plot.margin = margin(10, 30, 10, 30))
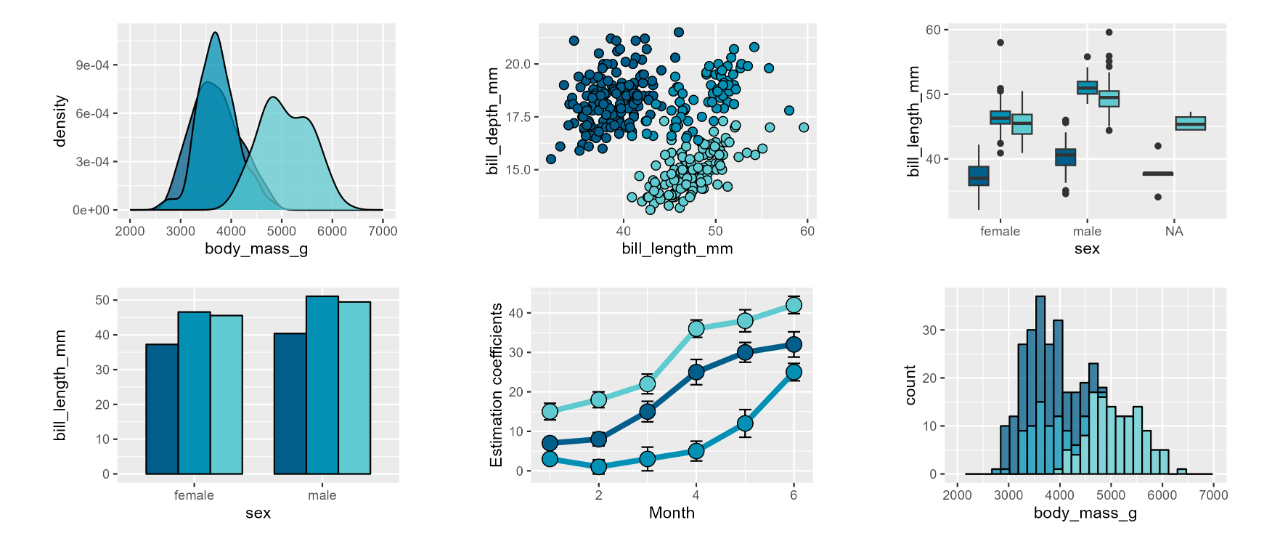
4.配色方案四


作图数据跟代码:
- library(tidyverse)
- library(palmerpenguins)
- library(patchwork)
- pal = c("#015e8a", "#0290b4", "#5fcad0")
- ## p1
- penguins %>%
- ggplot() +
- geom_density(aes(x=body_mass_g, fill=species),
- alpha = 0.75) +
- scale_x_continuous(limits = c(2000, 7000)) +
- scale_fill_manual(values=pal, guide="none") +
- theme(plot.margin = margin(10, 30, 10, 30))
- ## p2
- penguins %>%
- ggplot() +
- geom_point(aes(x=bill_length_mm, y=bill_depth_mm, fill=species),
- size=2.5, shape=21, color = "black") +
- scale_fill_manual(values=pal, guide="none") +
- theme(plot.margin = margin(10, 30, 10, 30))
- ##p3
- penguins %>%
- ggplot() +
- geom_boxplot(aes(x=sex, y=bill_length_mm, fill=species)) +
- scale_fill_manual(values=pal, guide="none") +
- theme(plot.margin = margin(10, 30, 10, 30))
- ##p4
- penguins %>%
- filter(!is.na(sex)) %>%
- ggplot(aes(x=sex, y=bill_length_mm)) +
- geom_bar(aes(fill=species),
- stat = "summary", fun="mean",
- color="black", width = 0.75, position = position_dodge()) +
- # geom_jitter(size=2) +
- scale_fill_manual(values=pal, guide="none") +
- theme(plot.margin = margin(10, 30, 10, 30))
- ##p5
- data = read_csv("./data/误差棒图.csv")
- data %>%
- mutate(upper = `Estimation coefficients` + SEM,
- lower = `Estimation coefficients` - SEM) -> df
- ggplot(data = df) +
- geom_errorbar(aes(x=Month, ymin=lower, ymax=upper),
- width = 0.25) +
- geom_line(aes(x=Month, y=`Estimation coefficients`, color=group),
- linewidth=1.75) +
- geom_point(aes(x=Month, y=`Estimation coefficients`, fill=group),
- shape=21, size=4.5) +
- scale_fill_manual(values=pal, guide="none") +
- scale_color_manual(values=pal, guide="none") +
- theme(plot.margin = margin(10, 30, 10, 30))
- ##p6
- penguins %>%
- ggplot() +
- geom_histogram(aes(x=body_mass_g, fill=species),
- alpha = 0.75, color="black") +
- scale_x_continuous(limits = c(2000, 7000)) +
- scale_fill_manual(values=pal, guide="none") +
- theme(plot.margin = margin(10, 30, 10, 30))
|
|